
When it comes to driving success in today’s mobile-first world, app engagement metrics are the secret sauce that separates the winners from the rest. These metrics are more than just numbers—they’re the pulse of your app, giving you a real-time view of how users are interacting with your product.
In a crowded marketplace, it’s not enough to simply launch an app and hope for the best. You need to know if your users are engaged, whether they’re coming back, and if they’re taking the actions that drive your business forward.
But with so many metrics to choose from, which ones really matter?
In this article, we’re breaking down the app engagement metrics that you should be paying attention to. Whether you’re looking to boost retention rates, increase session lengths, or optimize your push notification strategy, these insights will help you turn your app into a must-have for your users.
Sounds good? Let’s dive in.
Send Mobile App Push Notifications Today!
Push notifications are a super effective, low-cost marketing tool to help you grow your repeat traffic, engagement, and sales on autopilot.
7 Most Important Mobile App Engagement Metrics
Understanding app engagement metrics is crucial for any app developer or marketer looking to optimize user experience and drive growth.
These metrics provide valuable insights into how users interact with your app, helping you identify what’s working and where improvements are needed.
I recommend using PushEngage to send push notification campaigns.
PushEngage is the best push notifications service in the world. And we’re not just talking about the free version. It lets you connect with visitors after they leave your site with targeted push messages.
PushEngage is our first choice for push notification services and tools because it’s:
- Super easy to use
- Got a visual campaign builder with pre-built templates which requires little to no coding to set up
- Easy to set up fully automated push notification campaigns for any kind of site
- Fully equipped with iOS and Android SDKs to quickly develop, deploy, analyze, and manage app push campaigns
- Built with multiple options to send personalized push notifications for higher click rates
- Equipped with custom goal tracking, UTM parameters, and advanced analytics
- Got powerful push notification A/B testing options
And this is barely scratching the surface. Check out PushEngage’s full list of features before you go any further. The most incredible part about PushEngage is that it has a forever-free plan that you can try out before making a purchase decision.
Pro Tip: Check out our article on push notification cost analysis before you buy any service.
#1. Active Users (DAU & MAU)
When it comes to understanding how your app is performing, active users are a foundational metric.
This is where Daily Active Users (DAU) and Monthly Active Users (MAU) come into play. DAU refers to the number of unique users who engage with your app in a single day, while MAU measures the number of unique users who interact with your app over the course of a month.
Why Active User Metrics Are Important App Engagement Metrics
Why should you care about DAU and MAU?
These metrics are vital because they give you a clear picture of your app’s stickiness—how well it’s retaining users on a daily and monthly basis.
A high DAU/MAU ratio indicates that users find your app valuable enough to return frequently, which is a strong signal of user satisfaction and app success. If your DAU/MAU ratio is low, it might be a sign that users are downloading your app but not finding enough value to keep coming back.
According to a Mixpanel study of 2017, the DAU/MAU Ratio benchmark for SaaS B2B and B2C apps is 10-25%. B2C apps have a higher DAU/MAU Ratio, while the range is much lower for B2B.
Here’s the breakdown of DAU/MAUs accross the industries studied in the report:
| Industry | Average DAU/MAU | 50th Percentile DAU/MAU | 90th Percentile DAU/MAU | |
| 1 | Finance | 10.5% | 6.8% | 24.4% |
| 2 | SaaS | 13% | 9.4% | 28.7% |
| 3 | E-Commerce | 9.8% | 4.8% | 22.1% |
| 4 | Media | 11.9% | 8.5% | 26.1% |
How to Calculate the DAU/MAU Ratio
One of the most telling indicators of user engagement is the DAU/MAU ratio. It’s also known as stickiness.
To calculate stickiness, simply divide your DAU by your MAU, and multiply by 100 to get a percentage.
A DAU/MAU ratio of 20% or higher is generally considered healthy, as it suggests that a significant portion of your monthly users are engaging with your app on a daily basis.
Check out this free DAU/MAU ratio calculator if you want to figure out your number right now.
Monitoring this ratio over time can help you spot trends and identify periods of increased or decreased user activity. If you notice a drop in this ratio, it might be time to investigate and address any potential issues within your app that could be driving users away.
If your stickiness is dropping, one way to increase your DAU and MAU is to use push notifications to get your users back into your app.

Check out this article for some inspiration.
#2. Retention Rate
Retention rate is among the most crucial app engagement metrics. It tells you how well your app is keeping users engaged over time.
Retention rate is the percentage of users who return to your app after their first visit. Typically, retention is tracked over specific intervals, such as day 1, day 7, or day 30, giving you insights into both short-term and long-term user engagement.
App retention = Number of monthly active users / Number of monthly installs.
Here’s a look at the 2023 app retention rates broken down by Android and iOS apps.
From the data in 2023, roughly 12% daily retention rates are a good number.
Why Retention Rates Are Important App Engagement Metrics
User acquisition is no longer the sole focus when measuring the success of an app launch. A recent study suggests that 21% of users ditch an app after one use.
Retention rate is more than just a number; it’s a reflection of how well your app meets user needs and expectations.
A high retention rate indicates that users find your app valuable and are coming back for more, which is essential for building a loyal user base and sustaining long-term growth.
On the flip side, a low retention rate might suggest that users are losing interest quickly or encountering obstacles that prevent them from returning.
This metric is particularly important because acquiring new users can be expensive. By focusing on retaining your existing users, you can maximize the value of each user acquired, reducing your overall user acquisition costs and improving the lifetime value (LTV) of your app’s users.
How to Increase Your Retention Rates
Improving your retention rate starts with understanding why users might be dropping off. Here are a few strategies to help you keep users engaged:
- Personalized Onboarding: The first impression matters. A smooth and personalized onboarding process can help new users quickly understand your app’s value and how to use it, increasing the likelihood they’ll stick around.
- Push Notifications: Thoughtfully timed push notifications can serve as gentle reminders to re-engage users who haven’t interacted with your app in a while. However, it’s important to strike a balance—too many notifications can drive users away.
- In-App Messages: Use in-app messages to guide users through new features, offer tips, or provide personalized content. This can help deepen their engagement and encourage them to explore more of what your app has to offer.
- Regular Updates and Improvements: Keep your app fresh and relevant by regularly updating it with new features, bug fixes, and improvements based on user feedback. This shows users that you’re committed to enhancing their experience, which can boost retention.
By focusing on these strategies, you can create an app experience that keeps users coming back, ultimately improving your retention rate and driving long-term success.
Here’s an example of how Vegis used web push notifications to increase retention rates on their website.
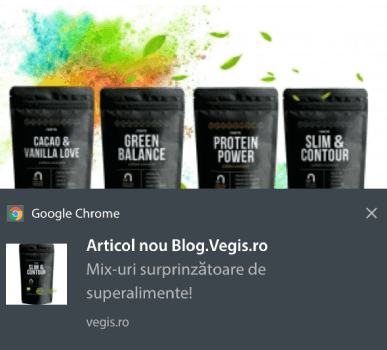
Check out the full case study and you can send push notifications that are similar to this example.
#3. Session Length and Frequency
Session length and session frequency are key app engagement metrics that provide deep insights into how users interact with your app.
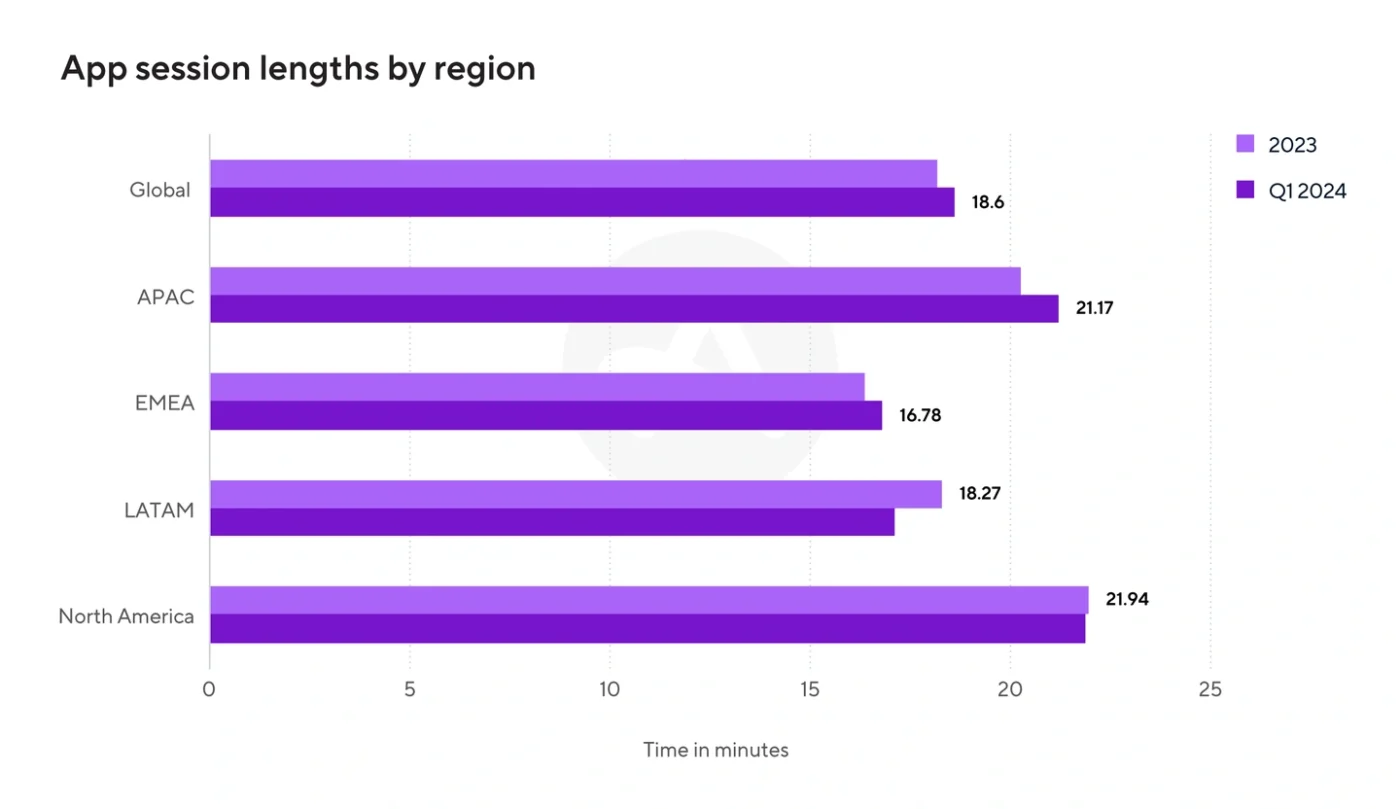
Session Length = the amount of time a user spends in your app during a single visit.
You calculate session length by subtracting the timestamp when the user opened the app from the timestamp when they closed it. Here’s a breakdown of session length by region compiled by Adjust.
Session Frequency = how often users return to your app over a specific period.
Session frequency is a useful metric for understanding how much value users are deriving from your product. Even if your average session length is high, you may want to find new ways to engage users if they are only checking in once a month.
Let’s consider an example to illustrate session frequency:
Imagine your app has the following usage statistics for a month:
- Total sessions: 1000
- Unique users: 250
To calculate the session frequency, divide the total sessions by the number of unique users:
1000 sessions / 250 users = 4 sessions per user per month
This means, on average, each user engaged with your app 4 times during that month.
Why Session Length and Frequency Are App Engagement Metrics That Matter
These metrics are crucial because they help you understand the depth and regularity of user engagement.
A longer session length suggests that users find your app engaging enough to spend extended periods within it, while higher session frequency indicates that users are consistently coming back for more.
Monitoring these metrics can help you identify patterns in user behavior. For example, if you notice that users spend a lot of time in your app but don’t return frequently, it might suggest that while they find value in your app, there’s something preventing them from becoming regular users.
On the other hand, if session frequency is high but session length is short, it might indicate that users are checking in often but not finding enough content or value to stay engaged for long.
How to Improve Session Length and Frequency
Improving session length and frequency involves creating an app experience that’s both engaging and convenient for users. Here are some tips to help you optimize these metrics.
- Enhance User Experience: A seamless, intuitive, and visually appealing user experience can encourage users to spend more time in your app. Focus on removing any friction points, such as slow load times or confusing navigation, that might cut sessions short.
- Content Updates: Regularly updating your app with fresh, relevant content can give users a reason to return frequently. This is particularly important for apps that rely on content consumption, like news apps or social media platforms.
- Gamification: Incorporating gamification elements like challenges, rewards, or streaks can incentivize users to engage with your app more frequently and for longer periods. This approach taps into users’ intrinsic motivation, making the app experience more compelling.
- Personalization: Personalizing the user experience, such as recommending content or features based on past behavior, can make your app more relevant and engaging, encouraging users to spend more time within it.
- Push Notifications: Use push notifications strategically to draw users back to your app. Notifications about new content, updates, or special offers can remind users to return and engage with your app more frequently.
By focusing on these areas, you can create an app experience that not only attracts users but also keeps them engaged over longer periods, ultimately boosting your session length and frequency metrics.
The short version is that you can improve session frequency using push notifications.

And you can improve your session length with a gamified customer experience.

If you see either of these app engagement metrics dip, you should take action right away.
#4. Churn Rate
Churn rate is one of the most telling app engagement metrics you can track, as it measures the percentage of users who stop using your app over a given period.
Essentially, it’s the opposite of retention rate—while retention tells you how many users are sticking around, churn rate tells you how many are leaving.
The churn rate measures the percentage of customers who stop using a product or service over a given time period. Here’s how to calculate it:
Formula: Churn Rate = (Number of Lost Customers / Total Customers at Start) x 100
Let’s break this down with an example:
- Time period: One month
- Customers at the start of the month: 250
- Customers lost by the end of the month: 10
Calculation: (10 lost customers / 250 total customers) = 0.04
To express this as a percentage, multiply by 100: 0.04 x 100 = 4%
Therefore, in this example, the monthly churn rate is 4%.
This metric helps businesses understand the rate at which they’re losing customers, allowing them to assess customer retention strategies.
Why Churn Rate Is One Of The Most Telling App Engagement Metrics
In the world of mobile applications, sustainable churn: A yearly user loss of 4-7% is typically viewed as acceptable for most apps.
However, the reality is more stark in the short term. On average, apps see a significant decline in user engagement very quickly after installation:
- Within just 3 days of downloading an app
- Around 77% of daily active users stop using it
This highlights the challenge app developers face in retaining users beyond the initial download and first use.
Understanding your churn rate is crucial because it directly impacts your app’s growth and sustainability.
A high churn rate means that a significant portion of your users are abandoning your app, which can be a red flag that something isn’t working as it should. This could be due to a variety of reasons, such as poor user experience, lack of compelling content, or technical issues.
This is why big app businesses use push notifications with deep links to bring back users to the app.
Churn rate is particularly important because it can have a cascading effect on your business.
If your app is losing users faster than it’s gaining them, your overall user base will shrink over time, making it harder to achieve your business goals. Additionally, acquiring new users can be costly, so minimizing churn helps you get the most value out of your existing users.
How to Reduce Churn Rate
Reducing churn rate involves identifying the root causes of user dissatisfaction and addressing them effectively. Here are some strategies to help you mitigate churn:
- Improve User Onboarding: A poor onboarding experience is a common reason for early churn. Ensure that new users understand how to navigate your app and quickly see the value it offers. Consider offering guided tours, tooltips, or a welcome video to help users get started.
- Regular User Feedback: Continuously gather feedback from your users to understand their pain points and preferences. This can be done through in-app surveys, user interviews, or monitoring reviews. Use this feedback to make data-driven improvements to your app.
- Enhance Customer Support: Offering responsive and helpful customer support can make a big difference in reducing churn. If users encounter problems, having access to timely support can prevent them from leaving out of frustration. Consider adding live chat, a comprehensive FAQ section, or a community forum to support users.
- Analyze Churn Patterns: Dive into your churn data to identify patterns. Are users churning after a specific update or feature release? Are there particular segments of users who are more likely to churn? Understanding these patterns can help you target your retention efforts more effectively.
- Re-engagement Campaigns: Use push notifications, email campaigns, or in-app messages to re-engage users who are at risk of churning. Offer incentives, such as discounts or exclusive content, to encourage them to return to your app.
By implementing these strategies, you can proactively address the factors driving users away from your app, ultimately reducing your churn rate and fostering a more loyal user base.
One of the easiest ways to reduce churn is to promote compelling content. You can use segments to send personalized push notifications that your users will be genuinely interested in.
For example, Waze sends notifications based on geolocation and app user habits like their regular route.

This allows them to add value to a user’s daily life and the helpful content improves the user’s quality of life. So, Waze users are way less likely to stop using the app.
#5. Conversion Rate
Conversion rate is a vital app engagement metric that measures the percentage of users who complete a desired action within your app.
This action could be anything from making a purchase, signing up for a subscription, or completing a form. Essentially, it tracks how effectively your app is turning users into customers, subscribers, or active participants in your app’s ecosystem.
Why Conversion Rate Is One Of The Biggest App Engagement Metrics
Conversion rate is directly tied to your app’s ability to generate revenue and achieve its business goals.
A high conversion rate means that your app is not only attracting users but also successfully guiding them toward actions that drive value for your business. Whether you’re aiming to boost in-app purchases, subscriptions, or ad clicks, understanding and optimizing your conversion rate is crucial for maximizing your app’s profitability.
Moreover, the conversion rate is a key indicator of how well your app’s user experience is designed.
If users are dropping off before completing important actions, it could signal issues like confusing navigation, a lack of trust, or an unclear value proposition. By closely monitoring this metric, you can identify and address these obstacles to improve your overall app performance.
How to Improve Your Conversion Rates
Improving your app’s conversion rate involves optimizing the user journey and removing any barriers that might prevent users from completing desired actions. Here are some strategies to help boost your conversion rate:
- Streamline the User Journey: Make it as easy as possible for users to complete the desired action. This might involve reducing the number of steps required, simplifying forms, or minimizing distractions on key screens. A smooth, frictionless experience can significantly increase the likelihood of conversion.
- Optimize Onboarding: The onboarding process is your first opportunity to guide users towards conversion. Use this stage to clearly communicate the value of your app and direct users to key actions, such as setting up a profile, enabling notifications, or starting a free trial.
- A/B Testing: Experiment with different versions of your app’s key elements—such as call-to-action buttons, layouts, and messaging—through A/B testing. This allows you to identify which variations are most effective at driving conversions and continuously optimize your app.
- Leverage Social Proof: Incorporate testimonials, reviews, or user-generated content within your app to build trust and encourage conversions. Social proof can reassure users that others have had positive experiences with your app, making them more likely to take action.
- Offer Incentives: Provide incentives like discounts, free trials, or exclusive content to motivate users to complete the desired action. Limited-time offers or rewards for taking action can create a sense of urgency and increase conversion rates.
- Personalized User Experience: Use data to personalize the user experience, offering recommendations or content tailored to individual user preferences. Personalization can make users feel more connected to your app, increasing their likelihood of converting.
By focusing on these strategies, you can enhance your app’s ability to convert users into valuable customers, driving both engagement and revenue growth. Spotify does a great job with this.

With PushEngage’s Android and iOS push notification SDKs, you can also send out personalized recommendations from your app.
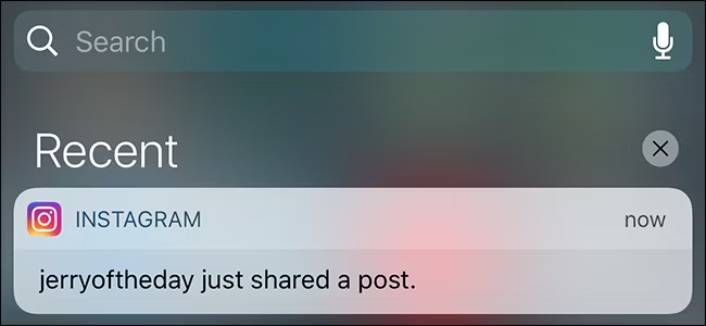
#6. Push Notification Engagement
Push notification engagement is a critical app engagement metric for any app that uses push notifications to re-engage users.
This metric typically includes the open rate (the percentage of users who open a push notification) and the click-through rate (the percentage of users who click on the content within the notification after opening it).
These metrics give you a clear view of how effective your push notifications are in capturing user attention and driving them back into your app.
Why Look At Push Notification Performance
Push notifications are a powerful tool for re-engaging users, prompting them to take action, and keeping your app top of mind. However, if not done correctly, they can also be intrusive or annoying, leading to users disabling notifications or even uninstalling your app. Monitoring push notification engagement helps you understand what resonates with your audience and what doesn’t.
High engagement rates indicate that your push notifications are well-timed, relevant, and valuable to your users. On the other hand, low engagement might suggest that your notifications are missing the mark—either because of poor timing, irrelevant content, or simply too many notifications being sent.
How to Improve App Push Engagement Metrics
To maximize the effectiveness of your push notifications, consider these best practices:
- Personalization: Tailor your push notifications based on user behavior, preferences, and location. Personalized notifications are more likely to capture attention and encourage users to engage with your app. For example, a fitness app might send a notification reminding a user to log their workout if they haven’t done so by a certain time.
- Timing: Send push notifications at times when users are most likely to be receptive. This might vary depending on your audience, so experiment with different times to see what works best. Avoid sending notifications too early in the morning or late at night, as this can be disruptive.
- Clear and Compelling Messaging: Keep your messages concise and to the point. Use action-oriented language that encourages users to click through, and make sure the value proposition is clear. For instance, instead of saying “Check out our new feature,” you could say “Discover new ways to stay organized with our latest feature!”
- Segmentation: Segment your user base to send more targeted notifications. Not all users are the same, and what works for one segment might not work for another. By segmenting your users based on criteria like activity level, purchase history, or demographics, you can create more relevant and effective notifications.
- Rich Media: Enhance your push notifications with rich media, such as images, videos, or GIFs. Visual content can make your notifications more engaging and eye-catching, increasing the likelihood that users will interact with them.
- A/B Testing: Test different variations of your push notifications to see what resonates best with your audience. This can include experimenting with different message formats, call-to-action buttons, or notification styles. Use the insights gained from these tests to continually refine your strategy.
By focusing on these best practices, you can improve your push notification engagement rates, ensuring that your notifications drive meaningful user interactions and help maintain a strong connection between your app and its users.
#7. In-App Purchases & Revenue Metrics
In-app purchases (IAP) and revenue metrics are critical for any app that monetizes through user transactions. In-app purchases refer to any purchase made within the app, such as buying virtual goods, unlocking premium features, or subscribing to a service.
Key revenue metrics include Average Revenue Per User (ARPU), Lifetime Value (LTV), and Customer Acquisition Cost (CAC).
These metrics collectively provide insight into how effectively your app is generating revenue from its user base.
Why App Engagement Metrics Are Directly Related to Revenue
Understanding in-app purchases and revenue metrics is essential for ensuring your app’s financial health and sustainability.
High revenue from in-app purchases indicates that users find value in your app’s offerings and are willing to spend money on it. Meanwhile, ARPU helps you gauge the average revenue generated from each user, allowing you to assess the profitability of your user base.
LTV gives you a long-term view of how much revenue a user is expected to generate over their lifetime, which is crucial for making informed decisions about marketing spend and user acquisition strategies.
A high LTV suggests that your app is successful in retaining users and encouraging repeat purchases. Conversely, CAC helps you understand how much it costs to acquire a new user, which is essential for calculating the overall return on investment (ROI) for your marketing efforts.
By keeping an eye on these metrics, you can identify opportunities to optimize your monetization strategy, improve profitability, and ensure that your app continues to grow.
How to Optimize Your Monetization Strategies
To maximize in-app purchases and optimize your revenue metrics, consider the following strategies:
- Offer Tiered Pricing Options: Provide a range of pricing options to cater to different user segments. For example, offer basic, premium, and deluxe packages with varying levels of access or features. This allows users to choose an option that fits their budget while still driving revenue.
- Incentivize Purchases: Use limited-time offers, discounts, or bundles to create a sense of urgency and encourage users to make a purchase. Offering special deals during holidays or events can also boost in-app purchases.
- Freemium Model: The freemium model, where the app is free to download but offers premium features for a fee, is a popular monetization strategy. By providing value upfront, you can entice users to upgrade to a paid version for additional benefits.
- Subscription Plans: If your app offers ongoing value, consider implementing a subscription model. Subscriptions can provide a steady stream of revenue and are particularly effective for apps that offer regular updates, content, or services.
- Optimize User Experience: A seamless and enjoyable user experience can lead to more in-app purchases. Ensure that the purchasing process is simple and straightforward, with minimal steps and clear instructions. Reducing friction in the purchase flow can significantly increase conversion rates.
- Leverage Data for Personalization: Use data analytics to understand user behavior and preferences. This allows you to offer personalized product recommendations or targeted promotions that are more likely to resonate with individual users, thereby increasing the likelihood of a purchase.
- A/B Testing Pricing Strategies: Experiment with different pricing models, such as one-time purchases versus subscriptions, or varying price points, to see which generates the most revenue. A/B testing can help you find the optimal pricing strategy for your app.
By implementing these monetization strategies and closely monitoring your in-app purchase and revenue metrics, you can enhance your app’s profitability and ensure its long-term success.
What to Do With Your App Engagement Metrics
Now that you know how to measure the most important app engagement metrics, it’s time for you to start creating your push notification campaigns. You should also study some great push notification examples first.
And if you’re new to push notifications, you should check out our article on push notification best practices before you start creating campaigns. Some of the best practices that we actively recommend include:
- Boost Clicks With Curiosity
- Personalize Each Push Notification
- Stand Out With Rich Media
- Reactivate Dormant Push Subscribers
- Keep Customers Informed
- Use Emojis Wherever You Can
- Create a Sense of Urgency
We recommend using PushEngage to create your push notification campaigns. PushEngage is the #1 push notification software in the market and your campaigns will be in safe hands.
So, if you haven’t already, get started with PushEngage today.


